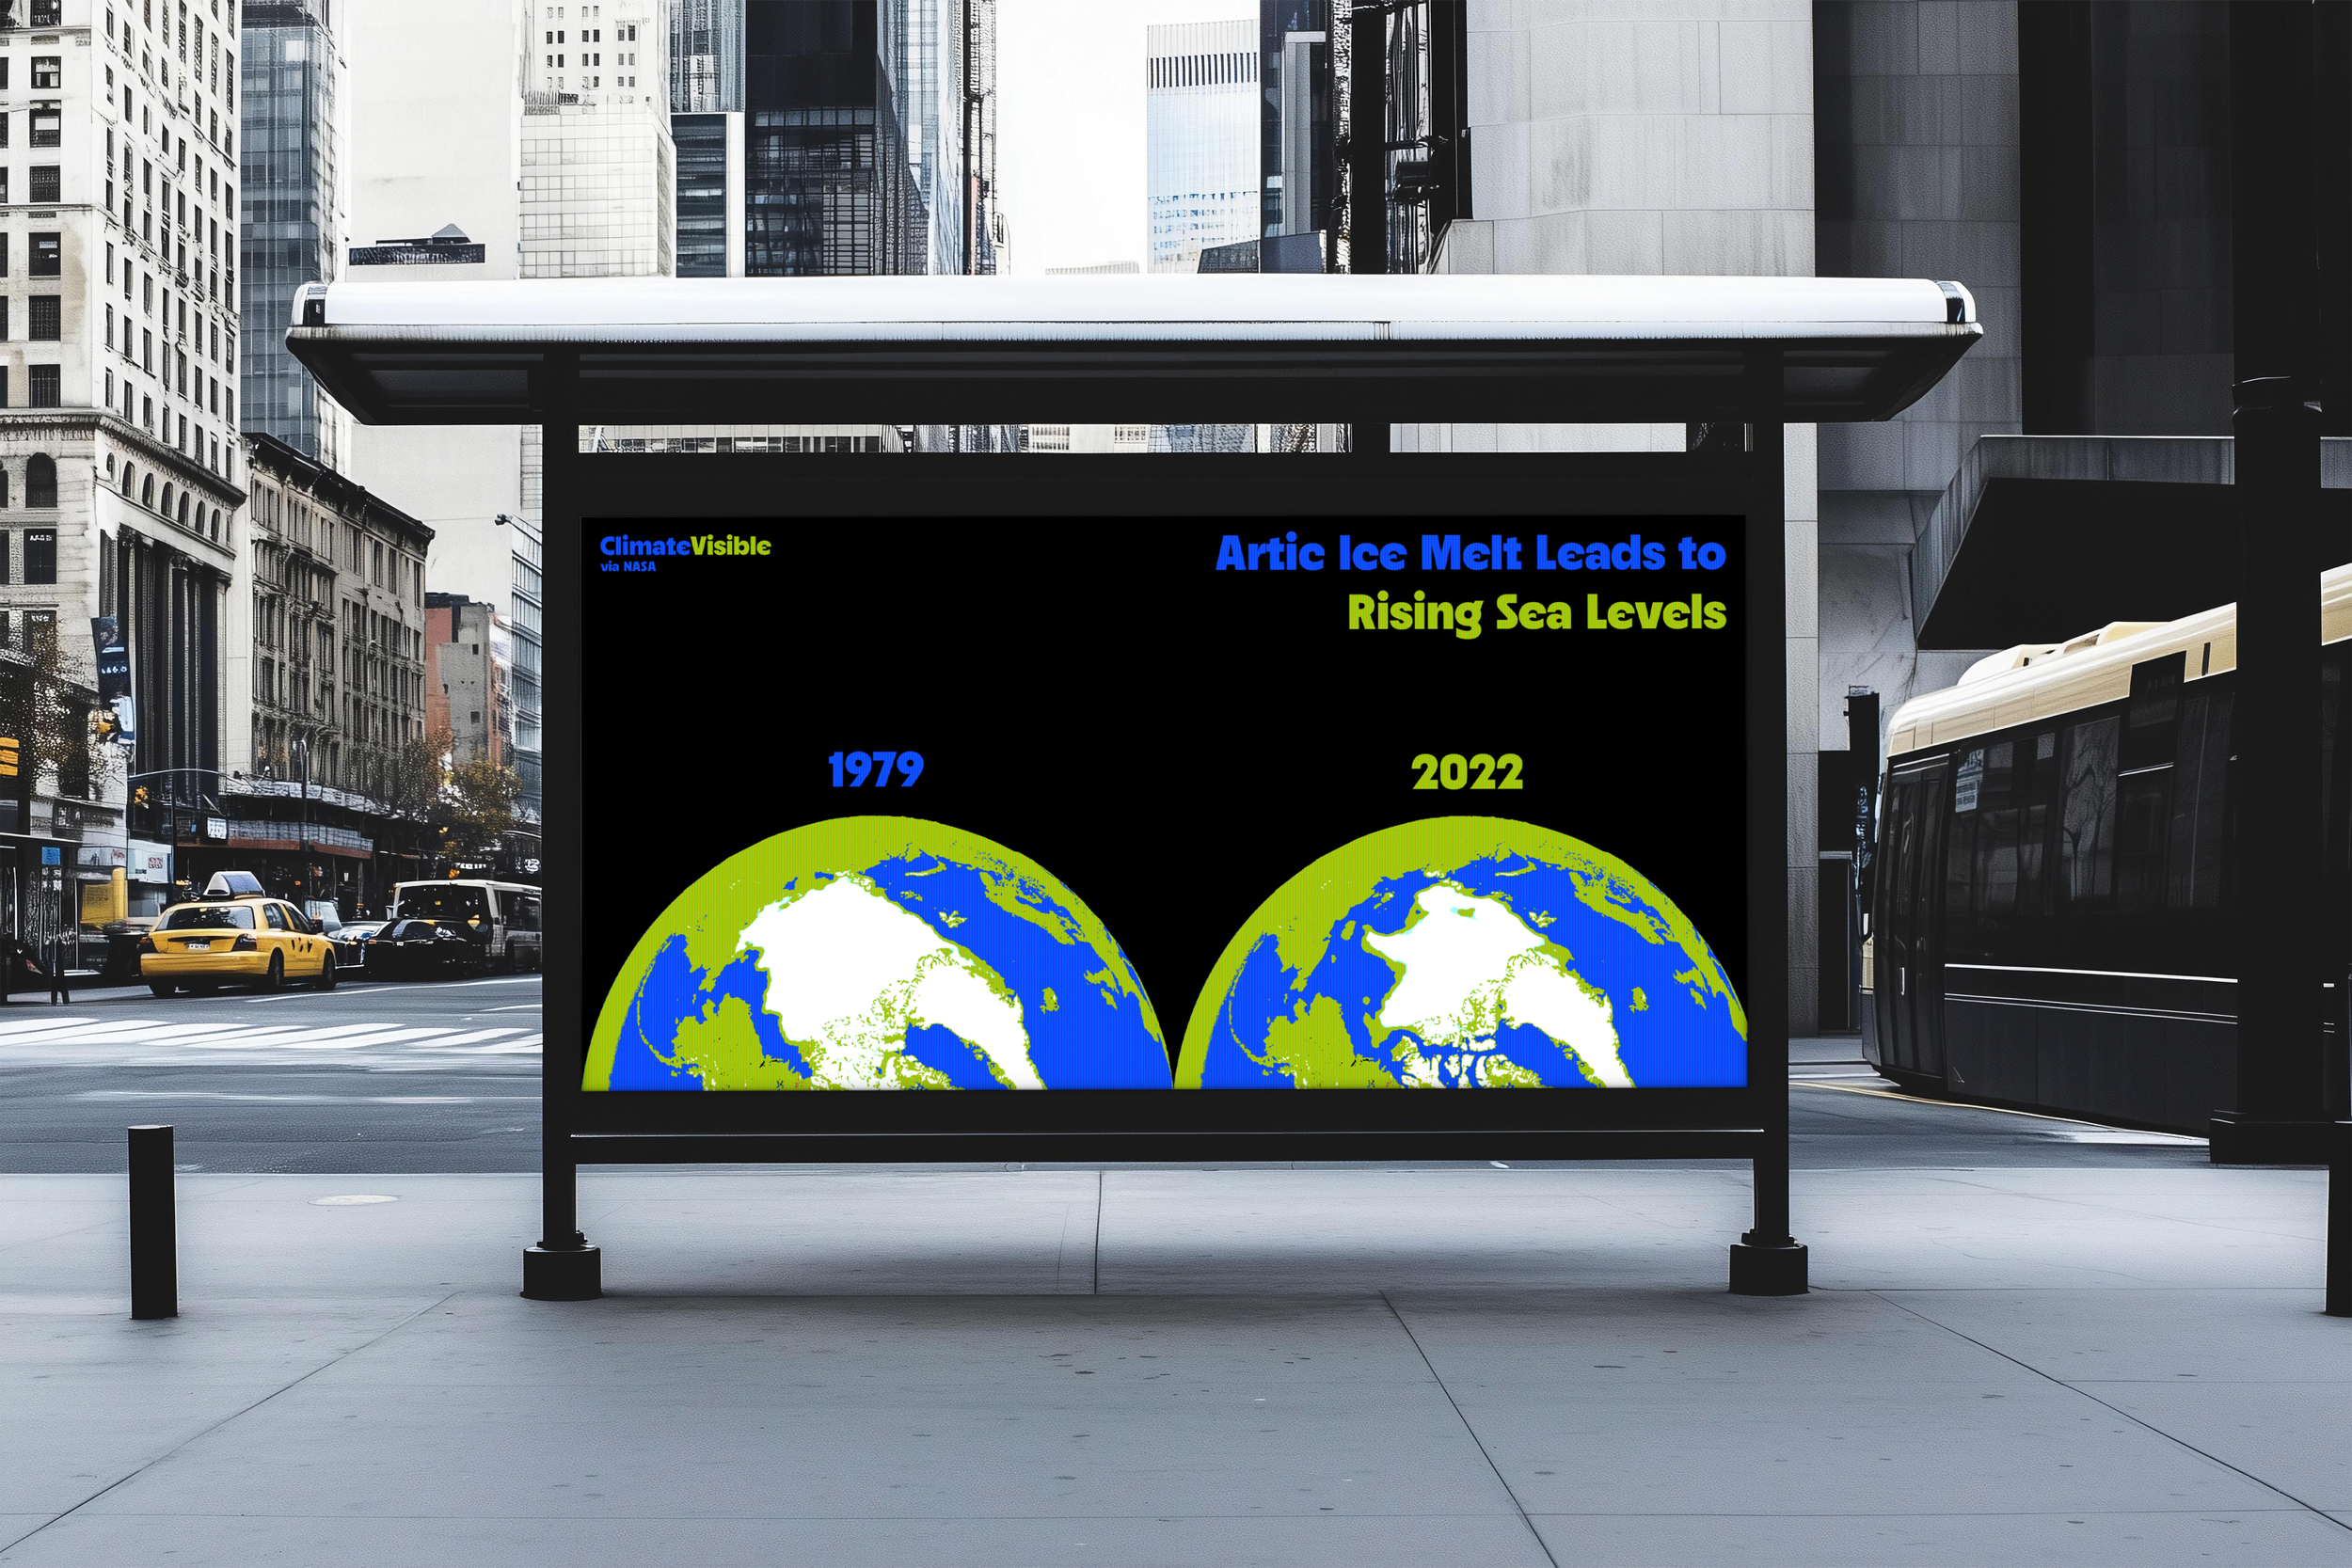
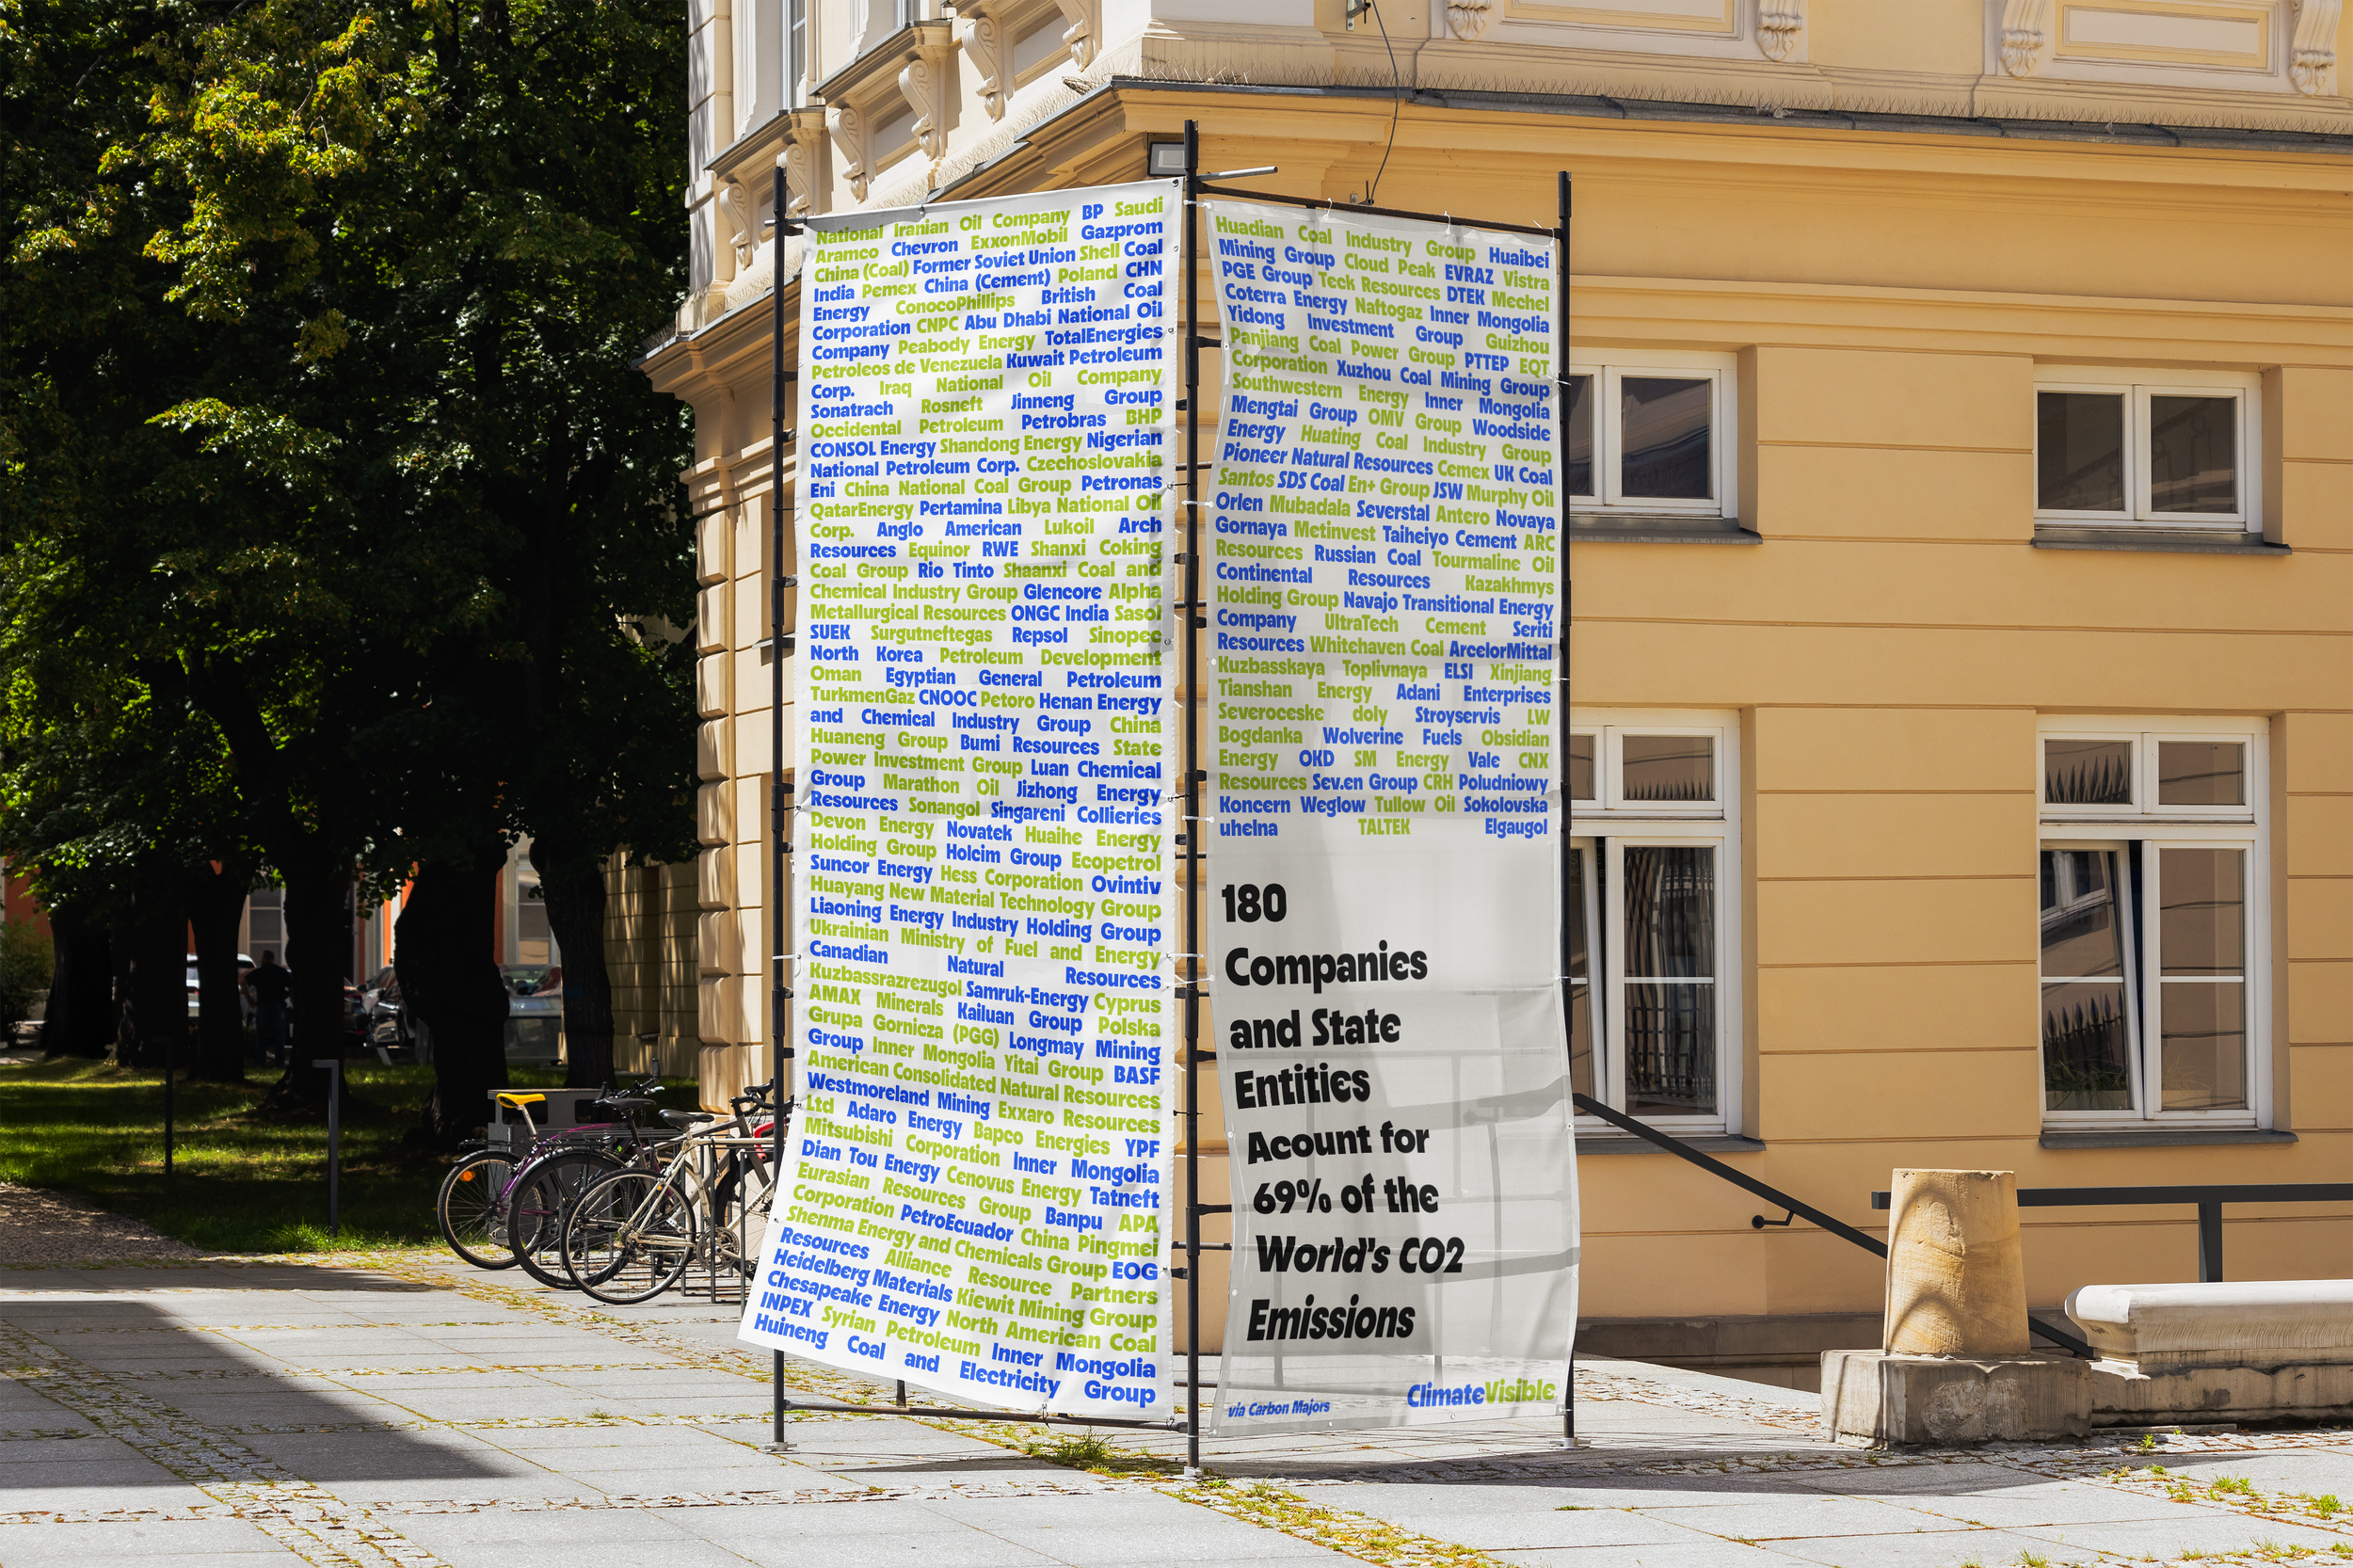
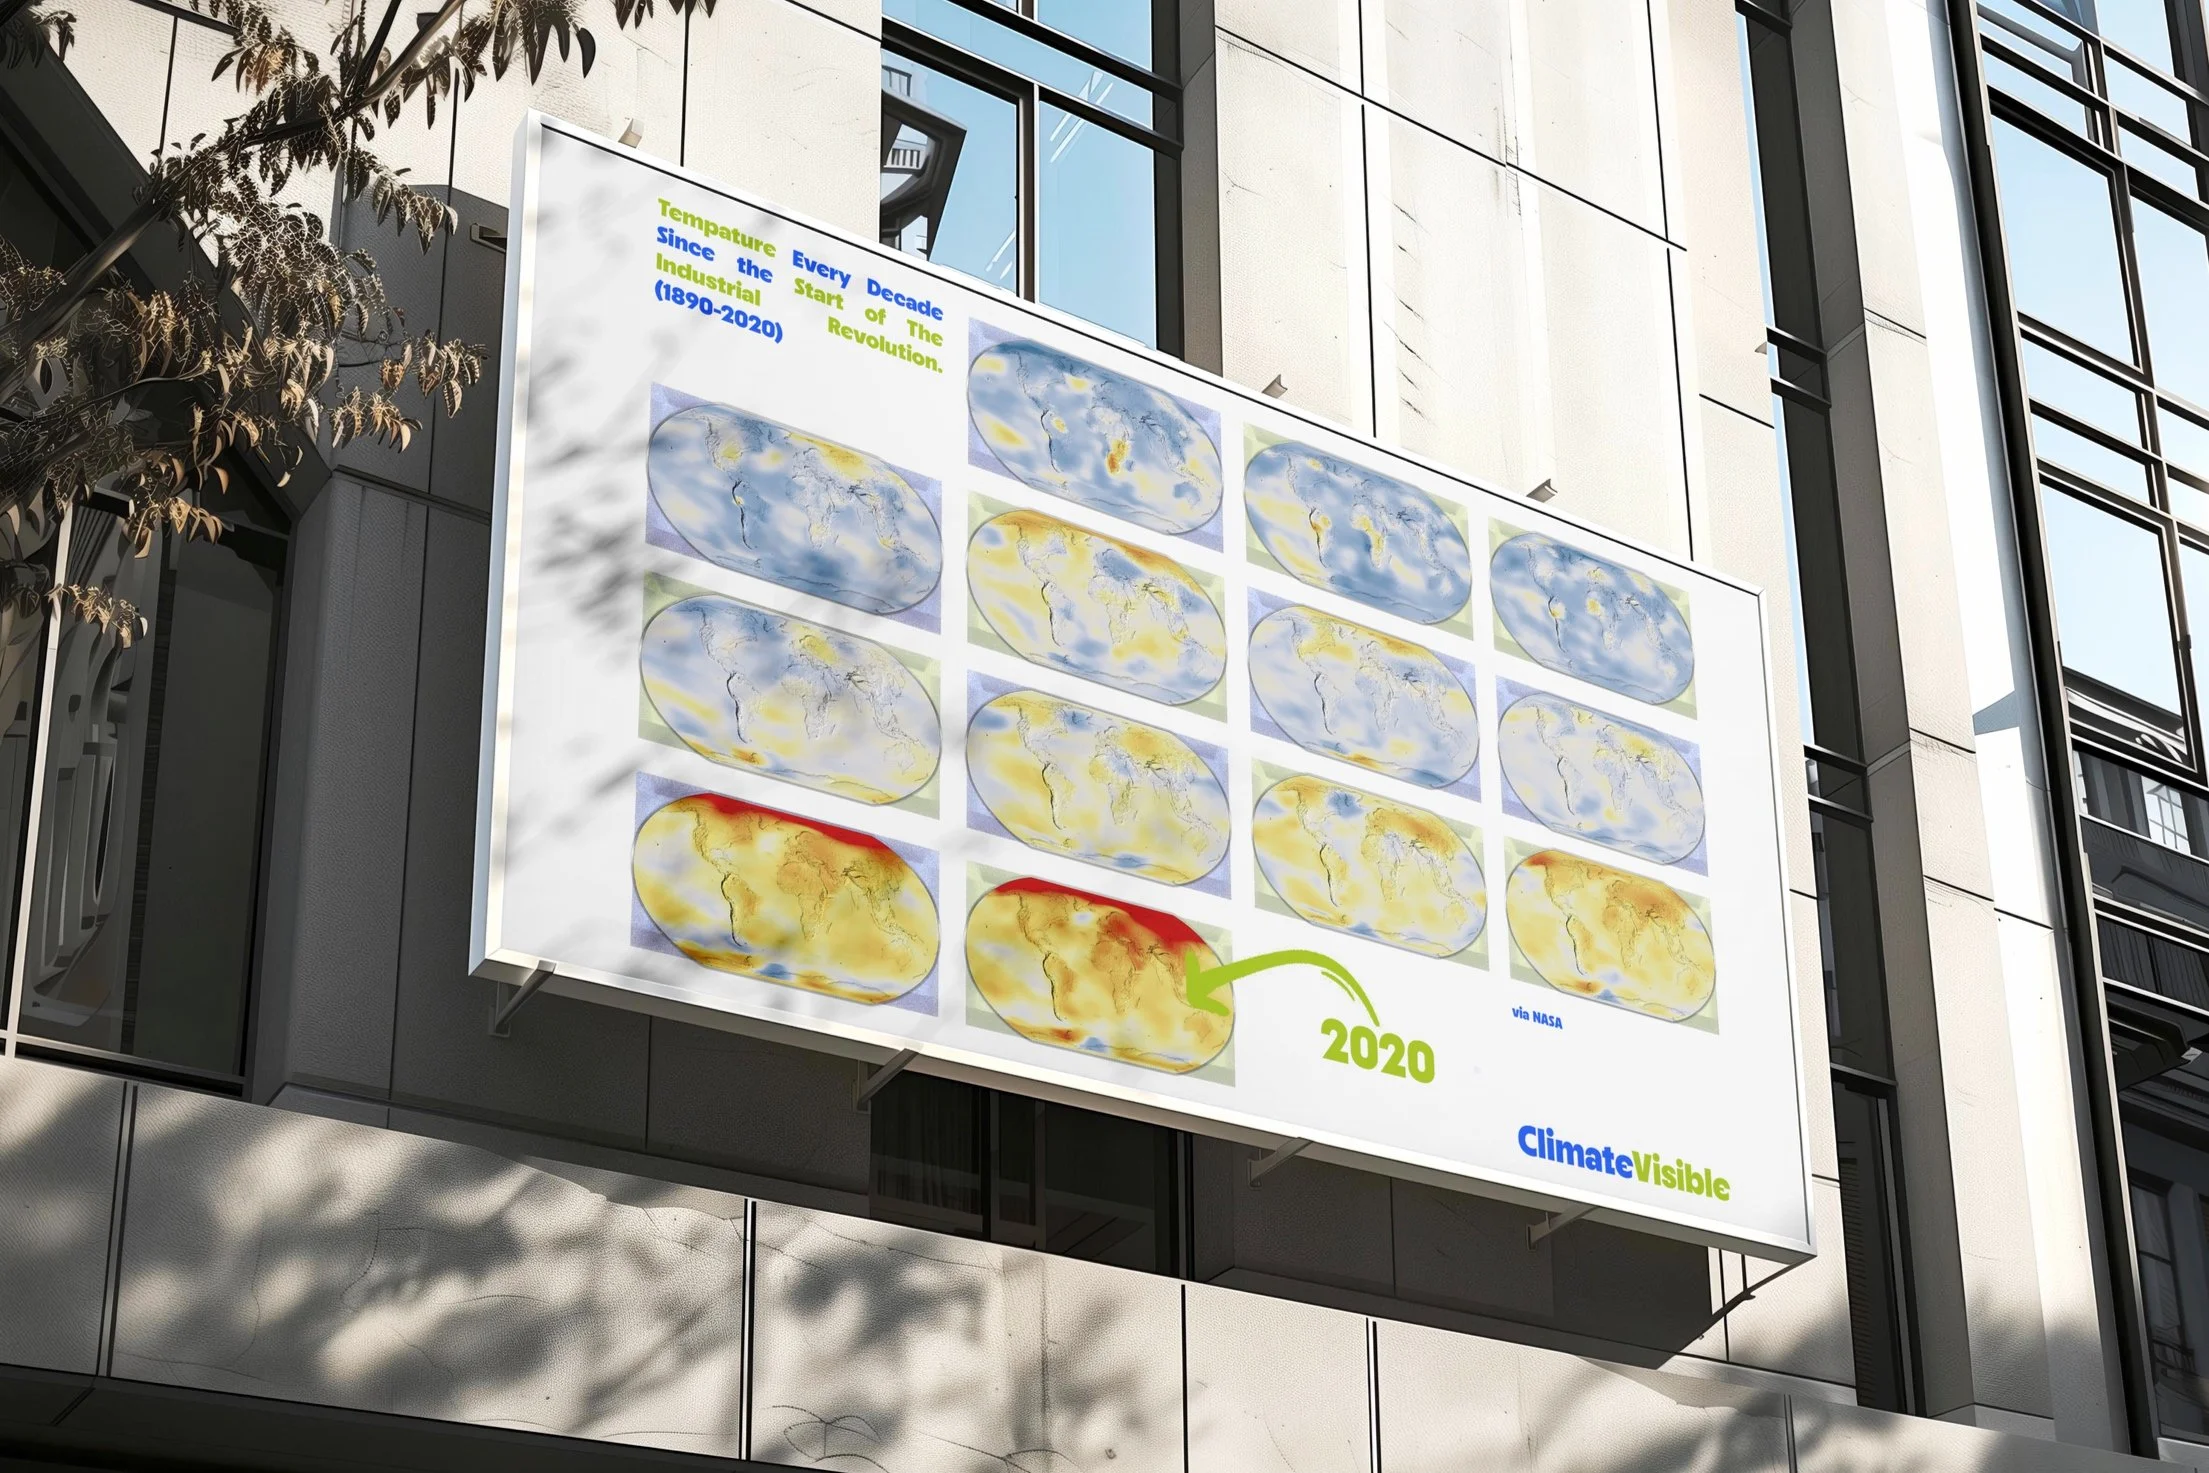
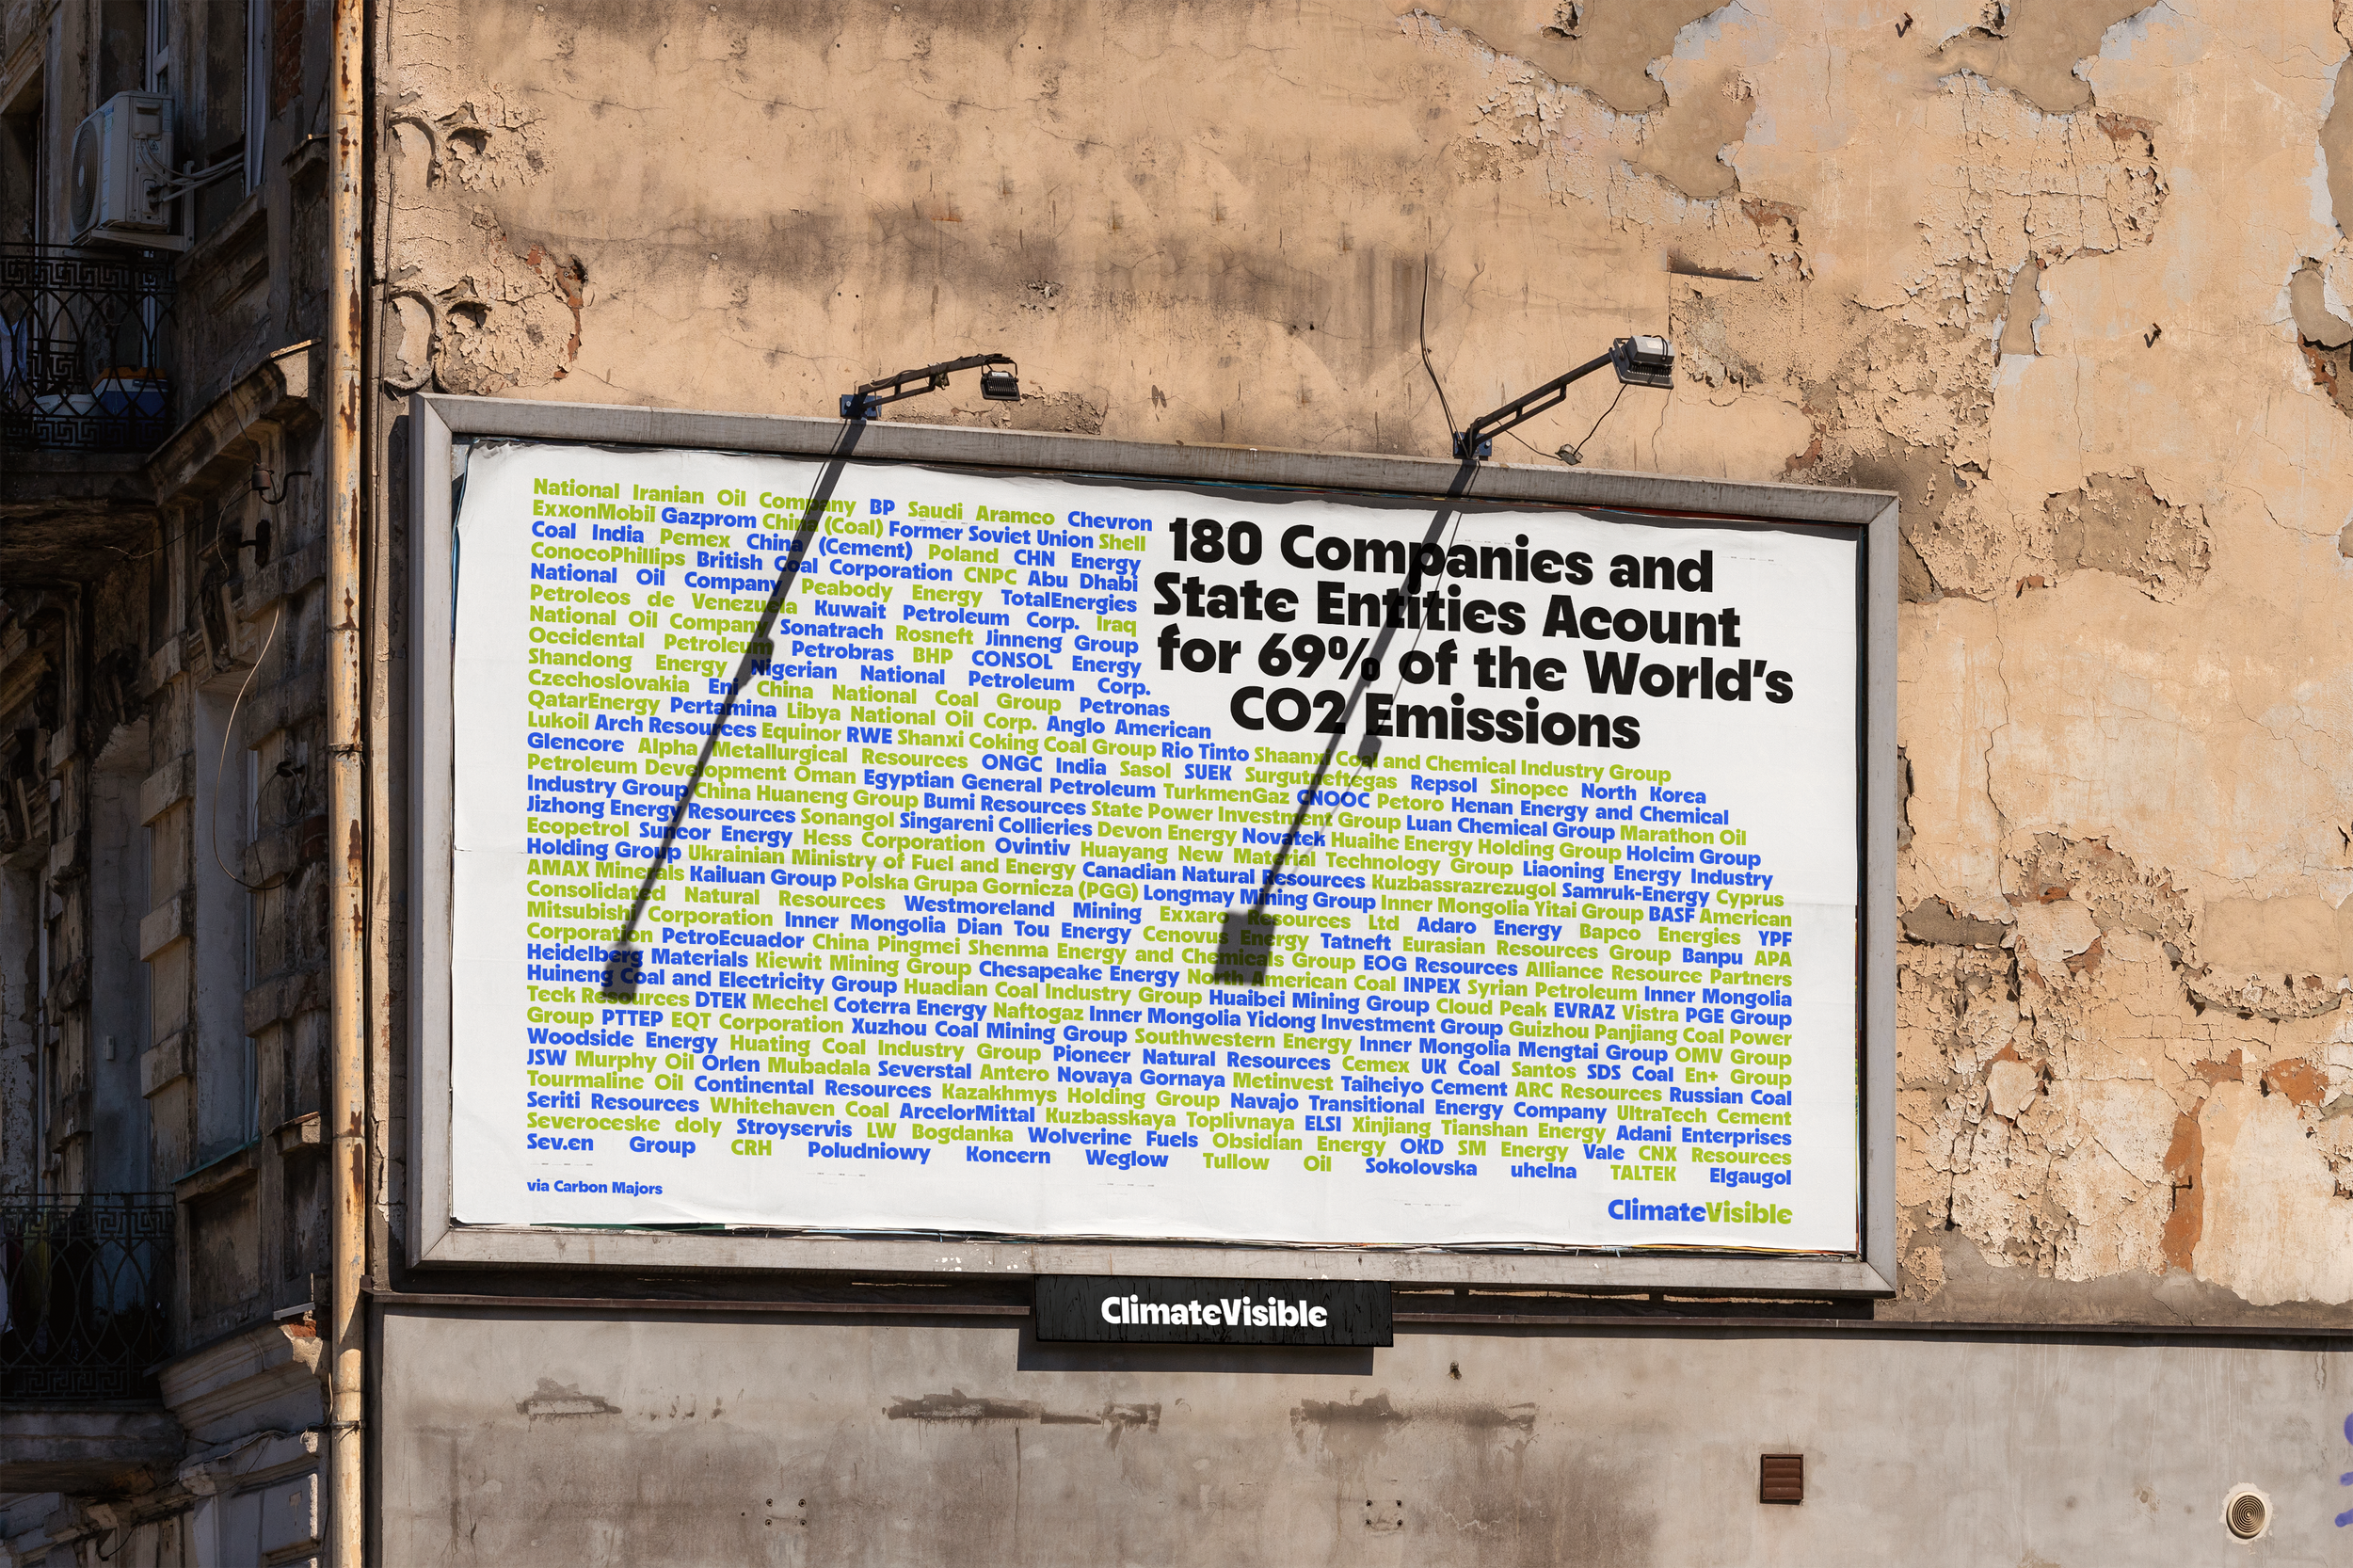
A proposal for a data visualization and information campaign that seeks to educate viewers about the causes and effects of climate change in public spaces.

climate visible campaign

The logo for Climate VISIBLE, with 'climate' in blue and 'VISIBLE' in green.

May
2025

Digital display showing two globe images, one from 1979 and one from 2022, illustrating Arctic ice melt and rising sea levels.
A large banner in an outdoor urban setting lists the names of 180 companies and state entities contributing to a report on CO2 emissions, with text in black on a white background. The banner is attached to a building, with trees and parked bicycles in the background.
A graph showing historical levels of atmospheric carbon dioxide over thousands of years, with recent levels rising sharply to a new high.
A billboard showing climate change maps of the world from 1890 to 2020. The maps depict temperature variations, with the 2020 map showing significant warming in red.
A framed infographic on a wall showing the distribution of Earth's water, with a comparison of total water and fresh water, highlighting that 97.5% of Earth's water is salty and brackish, and 2.5% is fresh water, mostly glaciers and ice caps.
A billboard listing 180 companies and state entities responsible for 69% of the world's CO2 emissions. The sign features a mix of company names in blue, green, and yellow text, and includes a black headline on a white background.
A digital infographic discussing climate change awareness and activism, highlighting the use of modern advertising, visual symbolism, and the importance of clear, factual communication to influence viewers and combat misinformation.
Colorful alphabet and number chart with special characters, displaying uppercase and lowercase letters in blue and green, along with numbers and symbols.
A four-section color grid with arbitrary characters and numbers written in blue and green text.
Previous
Previous

Saint Arthur Band

Next
Next

2025 Manchester Music & Jazz Festival